Using and Understanding Advanced Billing Subscriber Analytics Reports
Your Free Subscriber Analytics Reports are available from the “Insights” tab, within the “Free Subscribers” sub-tab.

Free Subscriber Growth
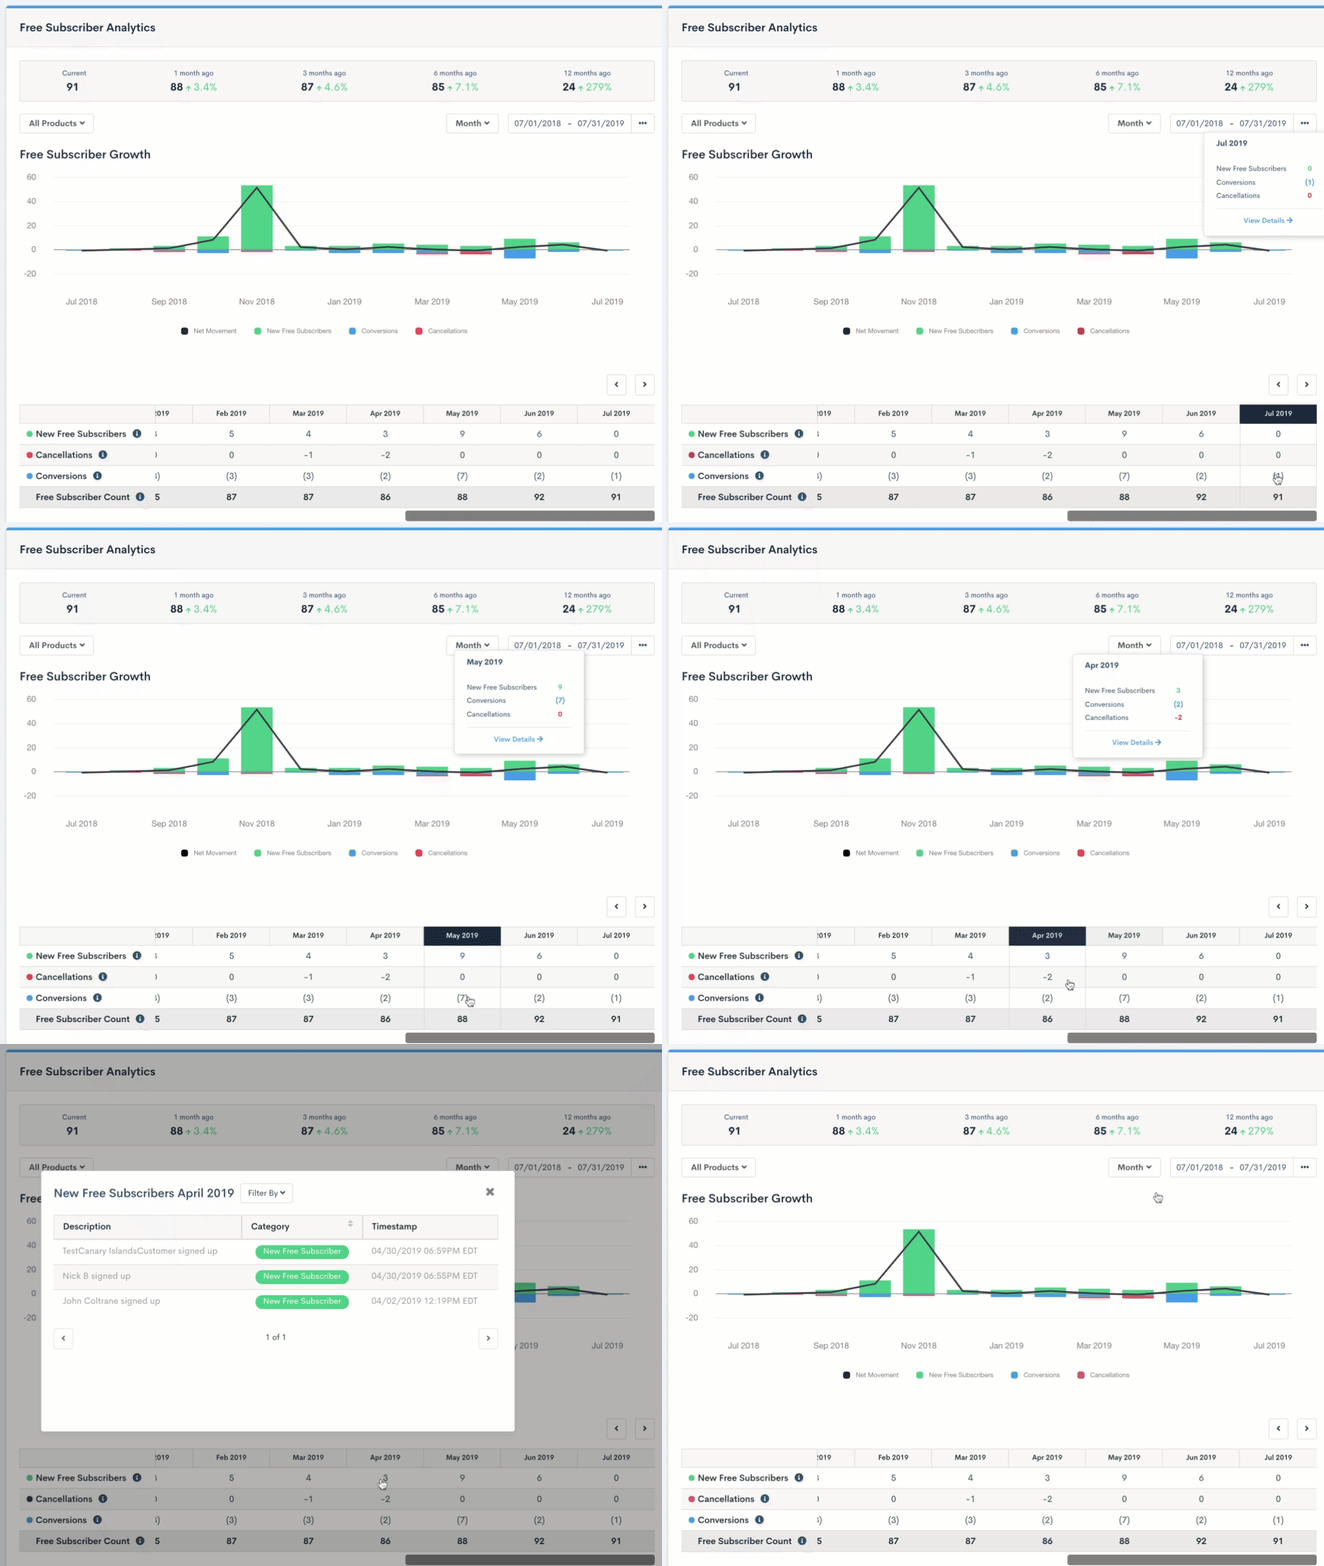
Free Subscriber Growth shows you how the number of paid subscribers you have changes over time. It tracks the incremental changes due to events impacting Subscriber Count across three categories:
- New Free Subscribers: Increases in Free Subscriber Count from new customers who are not generating revenue. This includes trials and subscribers on free products.
- Conversions: Decreases in Free Subscriber Count due to conversions to paying accounts.
- Cancellations: Decreases in Free Subscriber Count due to cancellations, expirations, and account closures.
Just like Paid Subscriber Growth in our Paid Subscriber Analytics, we present Free Subscriber Growth both as a chart and as a table of data. Note that you can click any cell of the table to drill into the accounts that comprise the data you see:

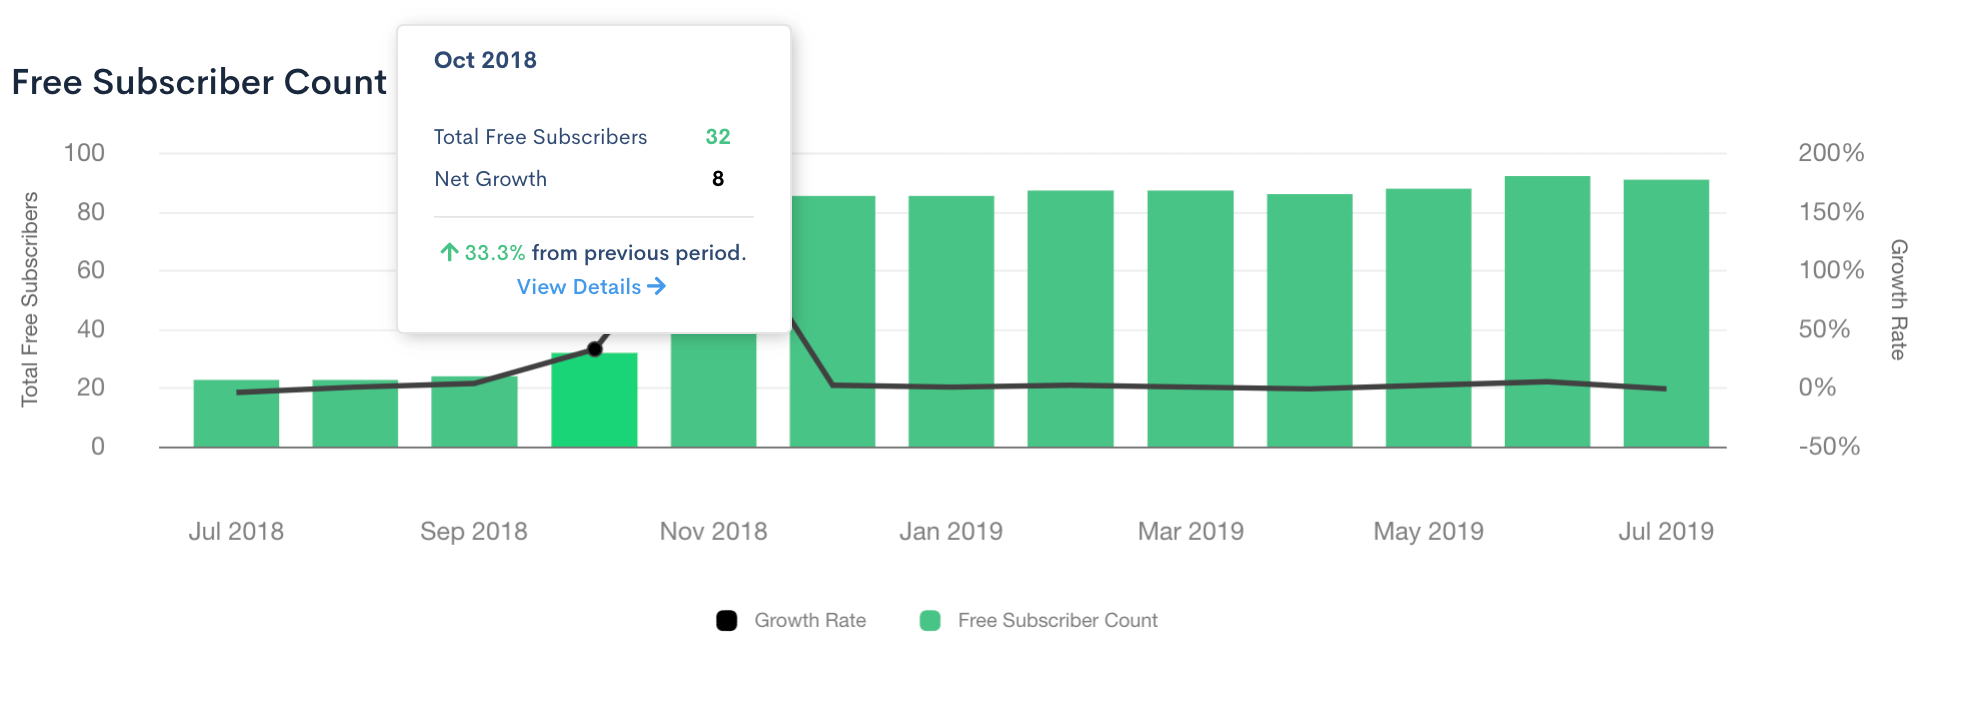
Total Free Subscribers
Your Total Free Subscribers is the point-in-time sum of all subscribers who are not generating revenue.
Who’s included?
- Trialing subscribers (free & paid)
- Subscribers on free products
- Subscribers generating revenue solely through one-time components
Who’s excluded?
Subscribers who are generating revenue through Products, On/Off Components, Quantity-Based Components, or Metered Usage Components.
A non-paying subscriber will continue to contribute to your Total Free Subscribers until:
- A cancellation occurs
- Total recurring revenue increase over zero (e.g. conversion to a paid product)

Free Subscriber Details & Events
In order to drill deeper into what is affecting your Free Subscriber Count, we provide a Details view of the events that impact your Free Subscriber Count.
This is available via any of the following methods:
- Clicking the “View Details” button when hovering over a bar in the Free Subscriber Growth Chart
- Clicking a cell in the data table for a given category in a period
- Clicking the “View Details” button when hovering a bar in the Free Subscriber Count Chart
From within the Details popup, you can change the category filter to focus on a given category or all categories.
Product Filters
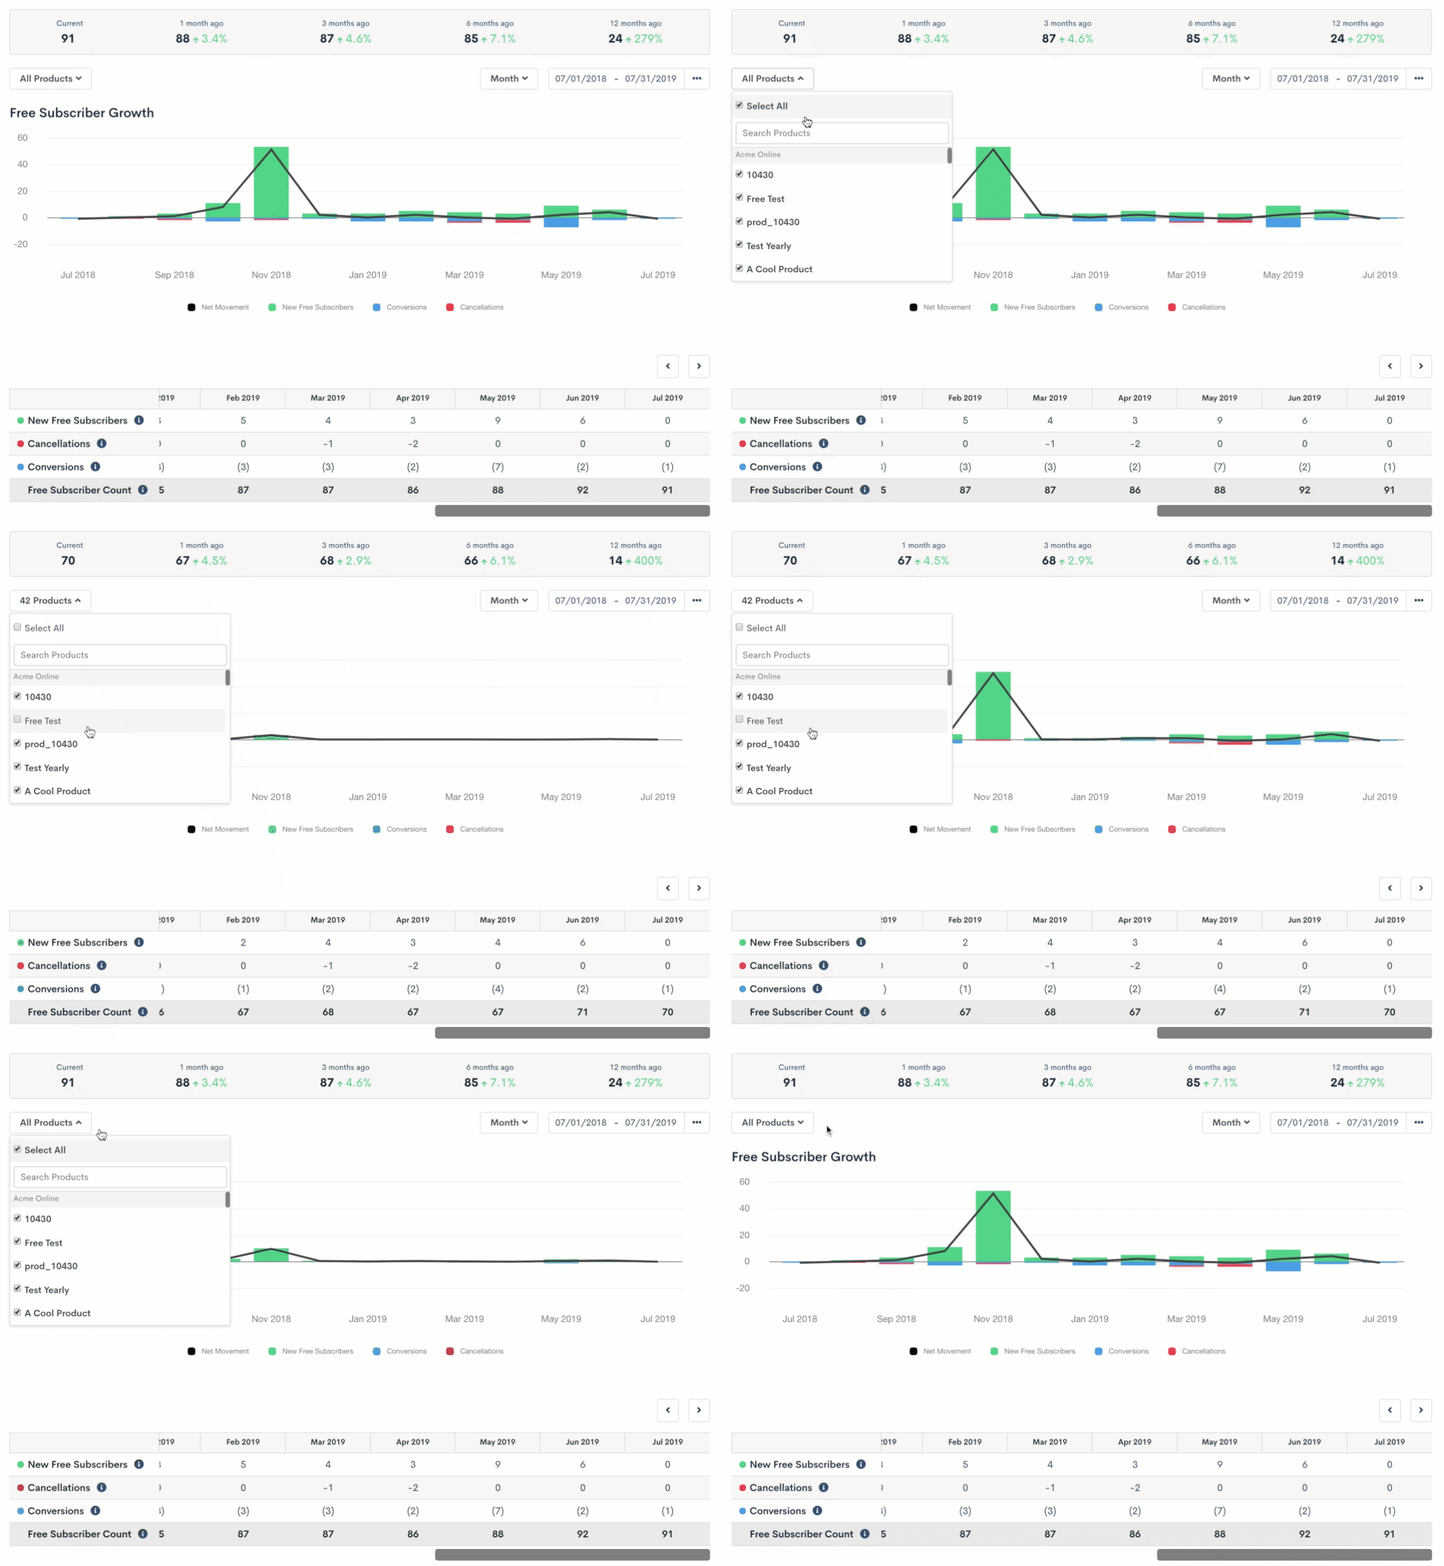
Your Free Subscriber Analytics can be filtered by product. This allows you to drill in to your product catalog to understand how subsets of products are performing.
Using the “All Products” dropdown, select the product(s) that you wish to filter by. As products are selected, your report will automatically refresh to show an updated report.
