Introduction
The Forecasting feature allows you to view, adjust, and save forecasts based on 3, 6, or 12 month averages. The forecast can be further optimized by including/excluding usage, and filtering on specific products. To see the potential impact of your actions and plans, growth and churn numbers can be adjusted and tracked against actual month-over-month progress.
When opening your Forecast, the initial view is your projected revenue and customer count for the coming 12 months, based on 12 months of historical data, including growth and churn rates.
Sample use cases:
- Adjusting for Sales Initiatives or Marketing Investments - If you are running sales initiatives that will have a positive impact on sales you can adjust your forecast up in increments to predict what impact the initiatives could have. Saving the view will allow you to go back to it and analyze how you did.
- Adjusting for programs to combat churn - Churn can have a serious impact on your forecasted revenue. Taking action to combat churn and reducing it by even 0.5% can greatly improve your forecast over time. Adjust the Churn % to see what the impact could be.
- Analyze your Install Base - Use the product filter to focus on a specific plan or plans, and set churn and growth to 0 to see how your current install base will perform over time.
How to access forecasting
Existing customers on Scale and above plans can start forecasting today. If you don’t see Forecasting under the Insights menu, contact us about getting it added to your current plan.
Generating a forecast
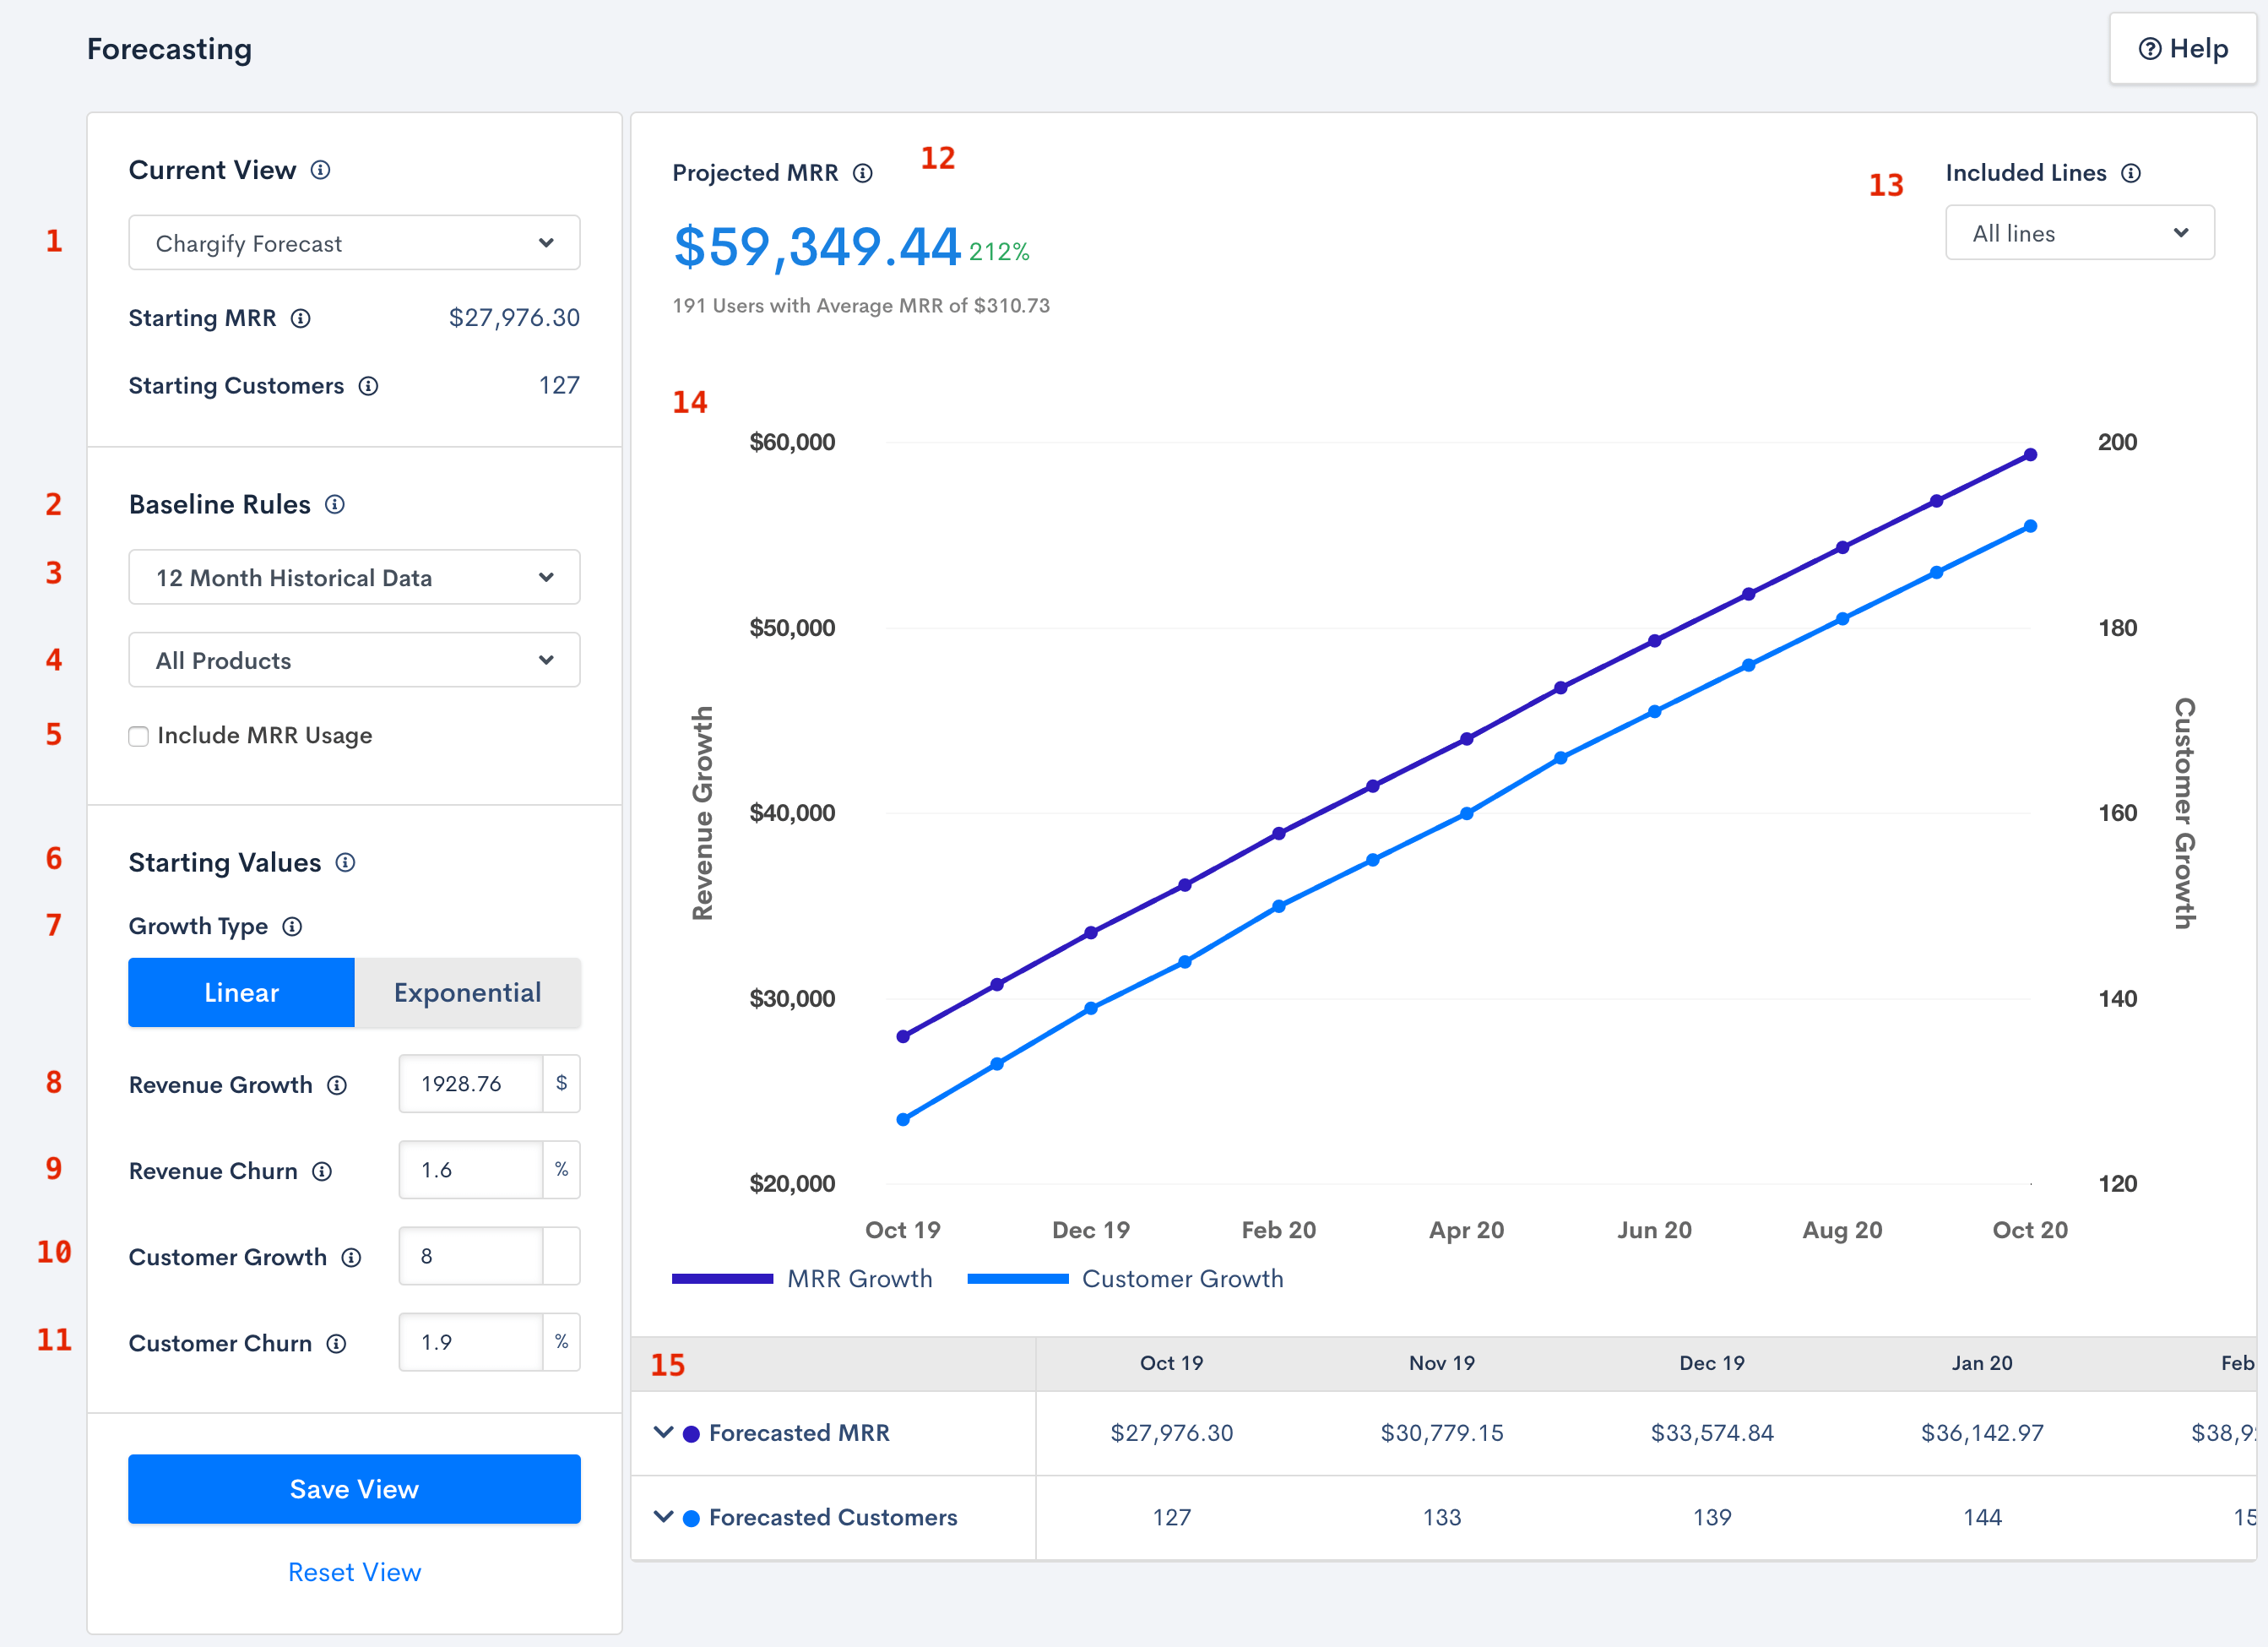
Forecasting
- View - You can choose from the Advanced Billing (default) view or any of your saved Views
- Baseline Rules - #3-5 below, used to determine the starting values
- Historical Data - The duration used to generate your starting values based on your historical performance
- Products - Which products to include when determining your starting values
- Include MRR Usage - Whether or not to include usage MRR in your starting values
- Starting Values - The growth and churn amounts used in your forecast (#7-11)
- Growth Type - Whether your forecast should use a linear or exponential calculation. Linear growth will be additive while exponential growth will increase by a percentage each month.
- Revenue Growth - The amount of revenue growth to calculate each month
- Revenue Churn - The rate of revenue churn to calculate each month
- Customer Growth - The amount of customer growth to calculate each month
- Customer Churn - The rate of customer churn to calculate each month
- Forecast Snapshot - Shows your ending MRR, total growth, customers and average MRR
- Included Lines - Choose which lines to include in the chart
- Results Chart - Your resulting forecast chart
- Results Table - Your resulting forecast table, with detailed MRR and customer calculations
Advanced Billing forecast
When you first load the Forecast report you will see your forecast generated based on your average historical MRR and Churn data for the past 12 months. The forecast will include all of your products and will exclude usage MRR.
Making changes to a forecast
You can make changes first to the (2) Filters to adjust your baseline rules. This will populate your (6) Starting Values with historical growth and churn numbers.
Additionally, you can modify the calculated (6) Starting Values to see what your forecast would look like if your growth or churn numbers improved or worsened.
Saving your forecast
You can save your forecast at any time by clicking the Save View button. Your new View will be available in the Views list.
Forecast Results
Your forecast results will be displayed in the chart and the table below it. When viewing a previously saved view, you will be able to see any Actual numbers if they are available.
Results Chart
Your results will be charted and you can hover over points in the forecast to view more information. You can also toggle which lines to see in the chart using the (13) Included Lines list.
- Baseline Revenue/Customer Forecast - your baseline forecast before making any changes to the (2) Baseline Rules or (6) Starting Values
- Adjusted Revenue/Customer Forecast - your adjusted forecast after making changes to the (2) Baseline Rules or (6) Starting Values
- Actual Revenue/Customers - your actual MRR and Customer counts (if available)
When saving a view, the saved values will then become your Baseline Revenue/Customer Forecast. You can then make any changes to have them be shown as the Adjusted Revenue/Customer Forecast.
Results Table
The results table contains your forecasted numbers. The result table always shows your Adjusted Revenue/Customer Forecast values.
How are the Starting Values calculated?
The (6) Starting Values are calculated by taking averages over the (3) Historical Data duration. Products and usage are included or excluded based on the selections for (4) Products and (5) Include MRR Usage. Below are the datapoints used for each starting value.
Calculation for Revenue Growth (linear)
(8) Revenue Growth (linear) is calculated by taking the average of the MRR report > Net Churn values.

Net Churn on the MRR Report
Calculation for Revenue Growth (exponential)
(8) Revenue Growth (exponential) is calculated by taking [current revenue growth amount] / [prior month’s MRR] for each month and averaging the values.
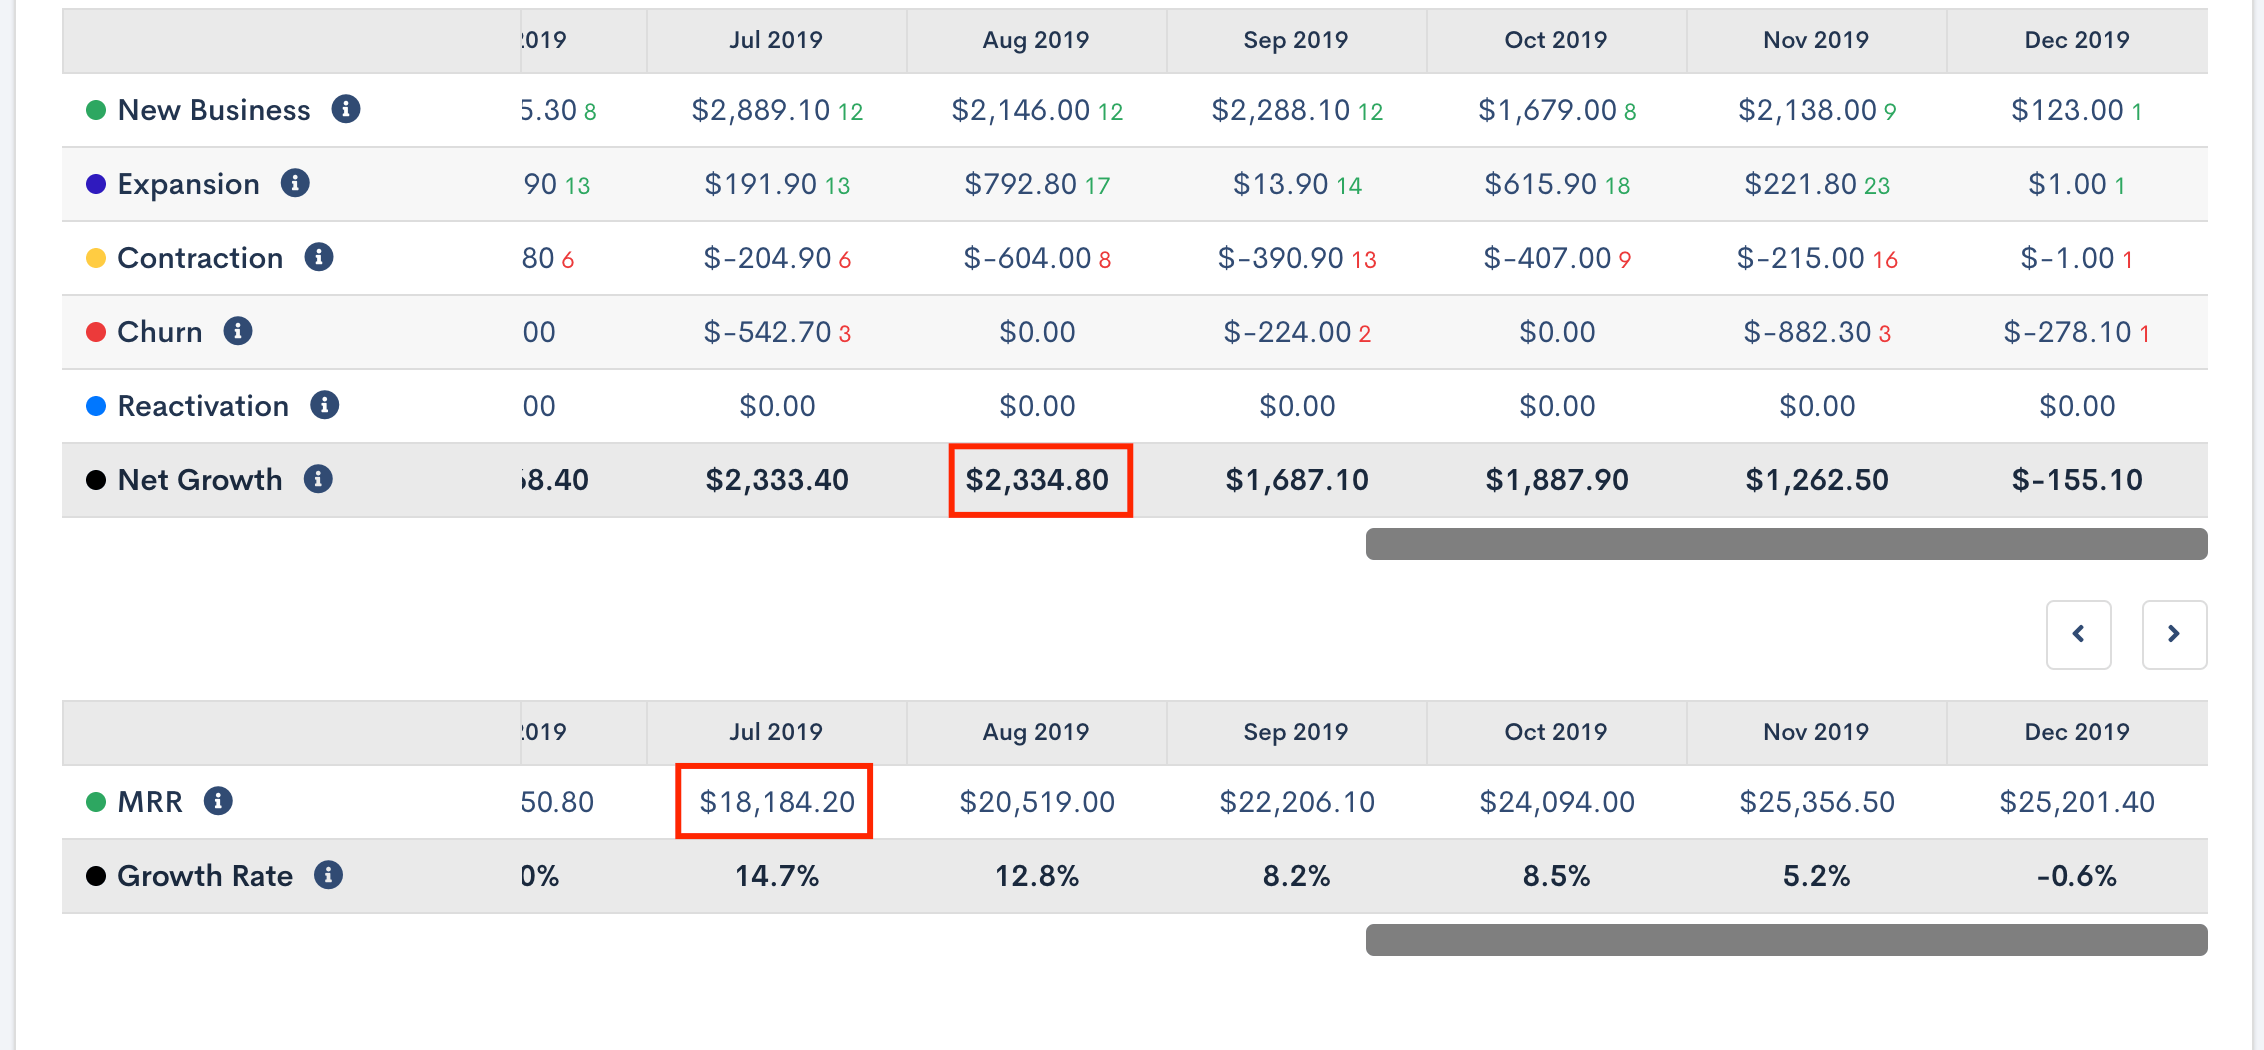
Fields used on the MRR report for Revenue Growth Percentage calculation
Calculation for Revenue Churn
(9) Revenue Churn is calculated by taking the average of the Gross MRR Churn values on the Churn Analytics report.

Revenue Churn
Calculation for Customer Growth (linear)
(10) Customer Growth (linear) is calculated by taking the average of [new business] + [reactivation] on the Paid Subscriber Report.

Customer Growth (linear)
Calculation for Customer Growth (exponential)
(10) Customer Growth (exponential) is calculated by taking the average of ( [new business] + [reactivations] ) / [prior month paid subscriber count].

Customer Growth (exponential)
Calculation for Customer Churn
(11) Customer Churn is calculated by averaging the Paid Subscriber Churn on the Churn Analytics report from the MRR Churn table.
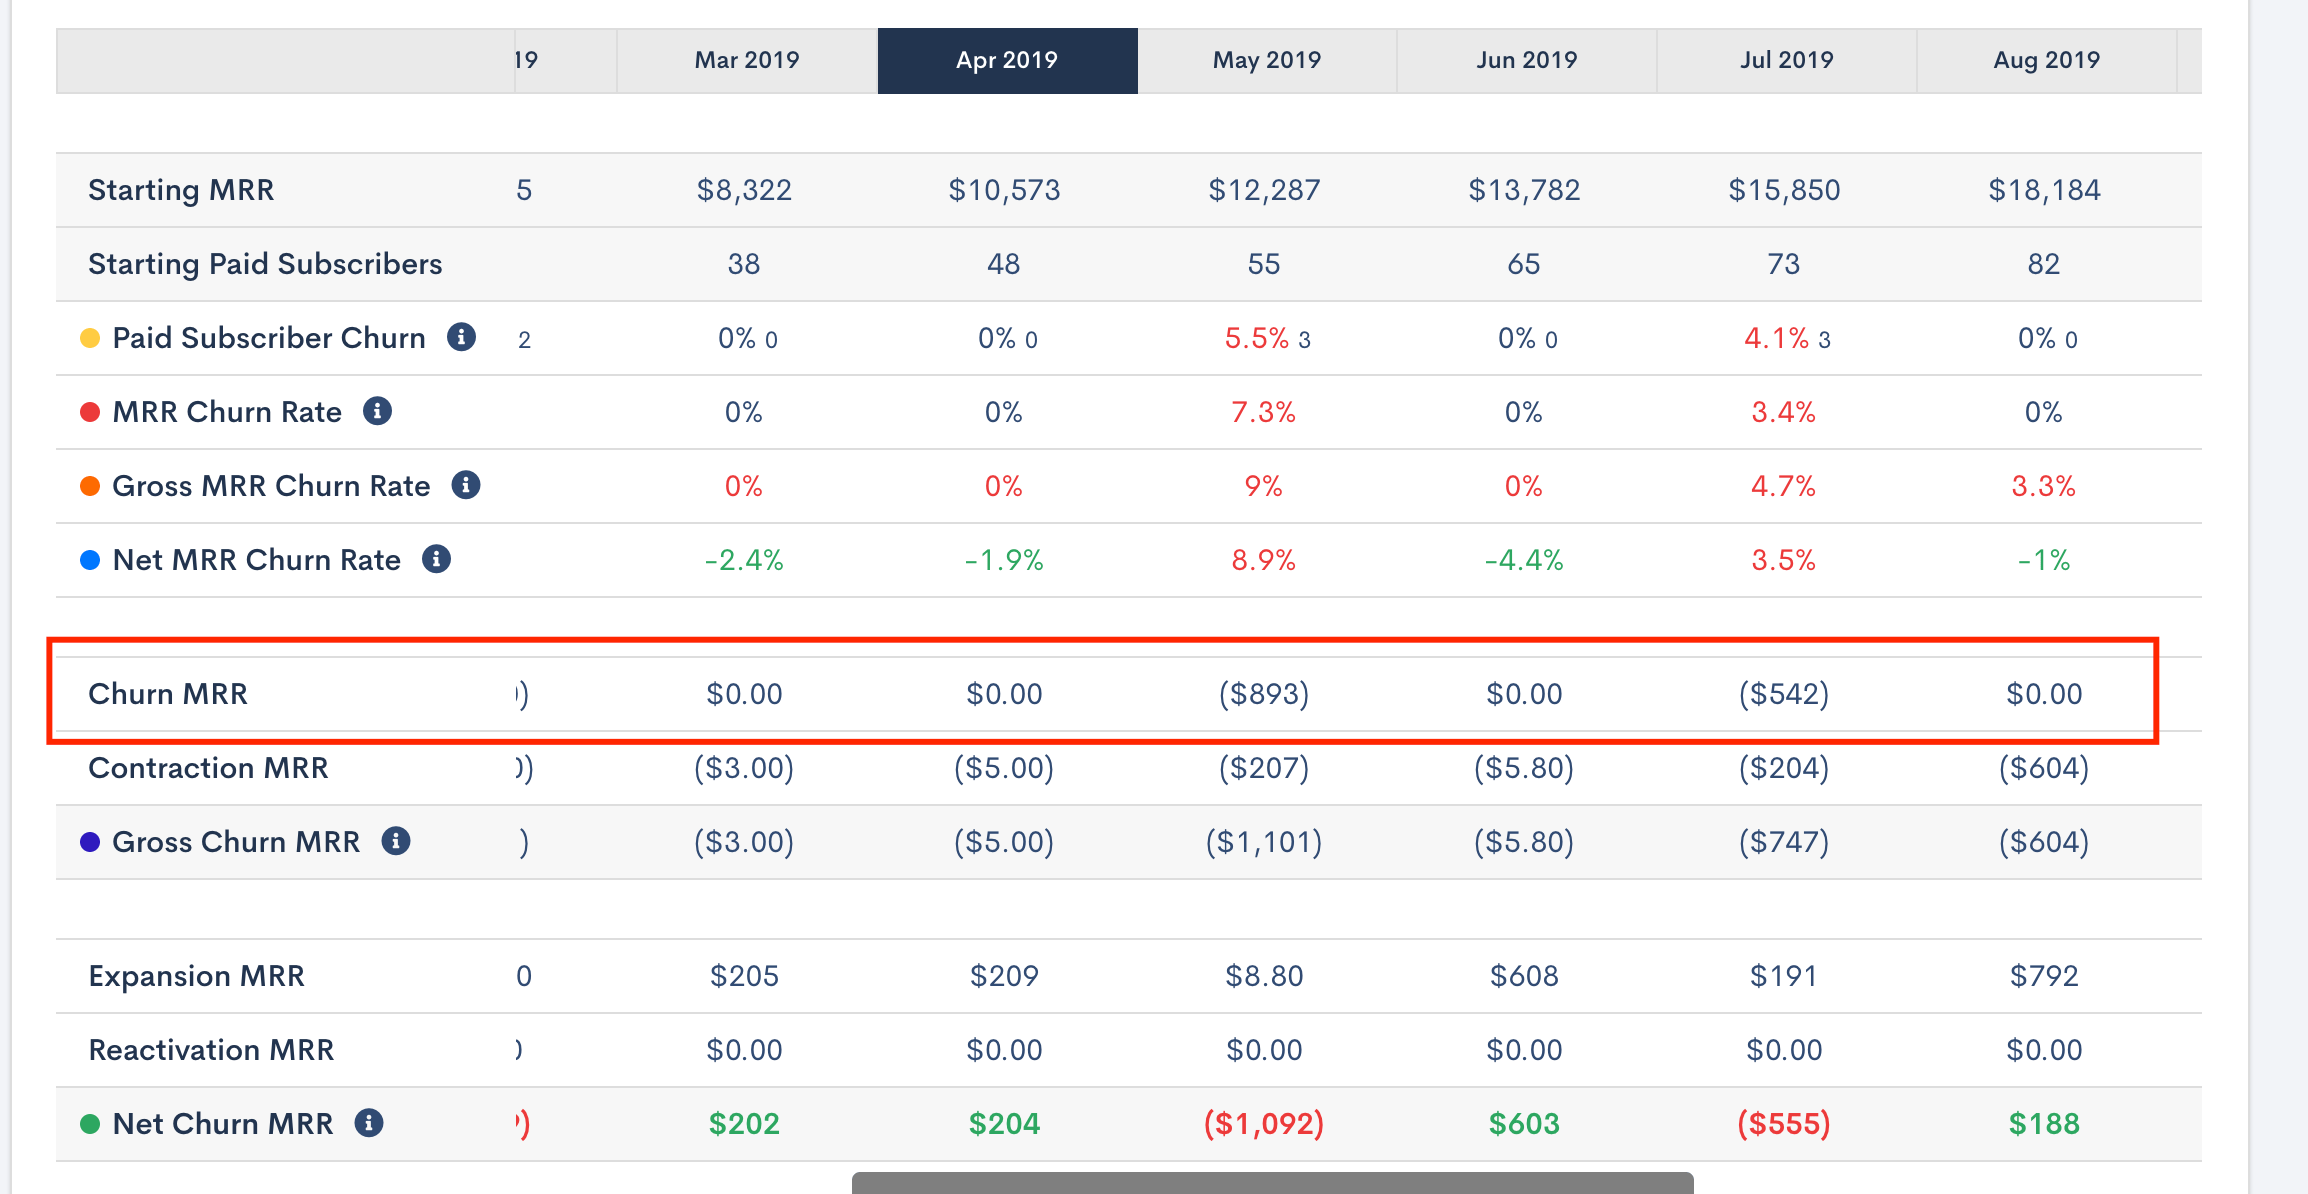
Customer Churn
How is the forecast calculated?
The (6) Starting Values are used as a starting point for your forecast. Each month your revenue and customer numbers are calculated by taking the prior month and adding growth and subtracting churn. When new customers are added or churned, revenue will also be added or subtracted based on the average MRR per customer.
Linear forecast calculations
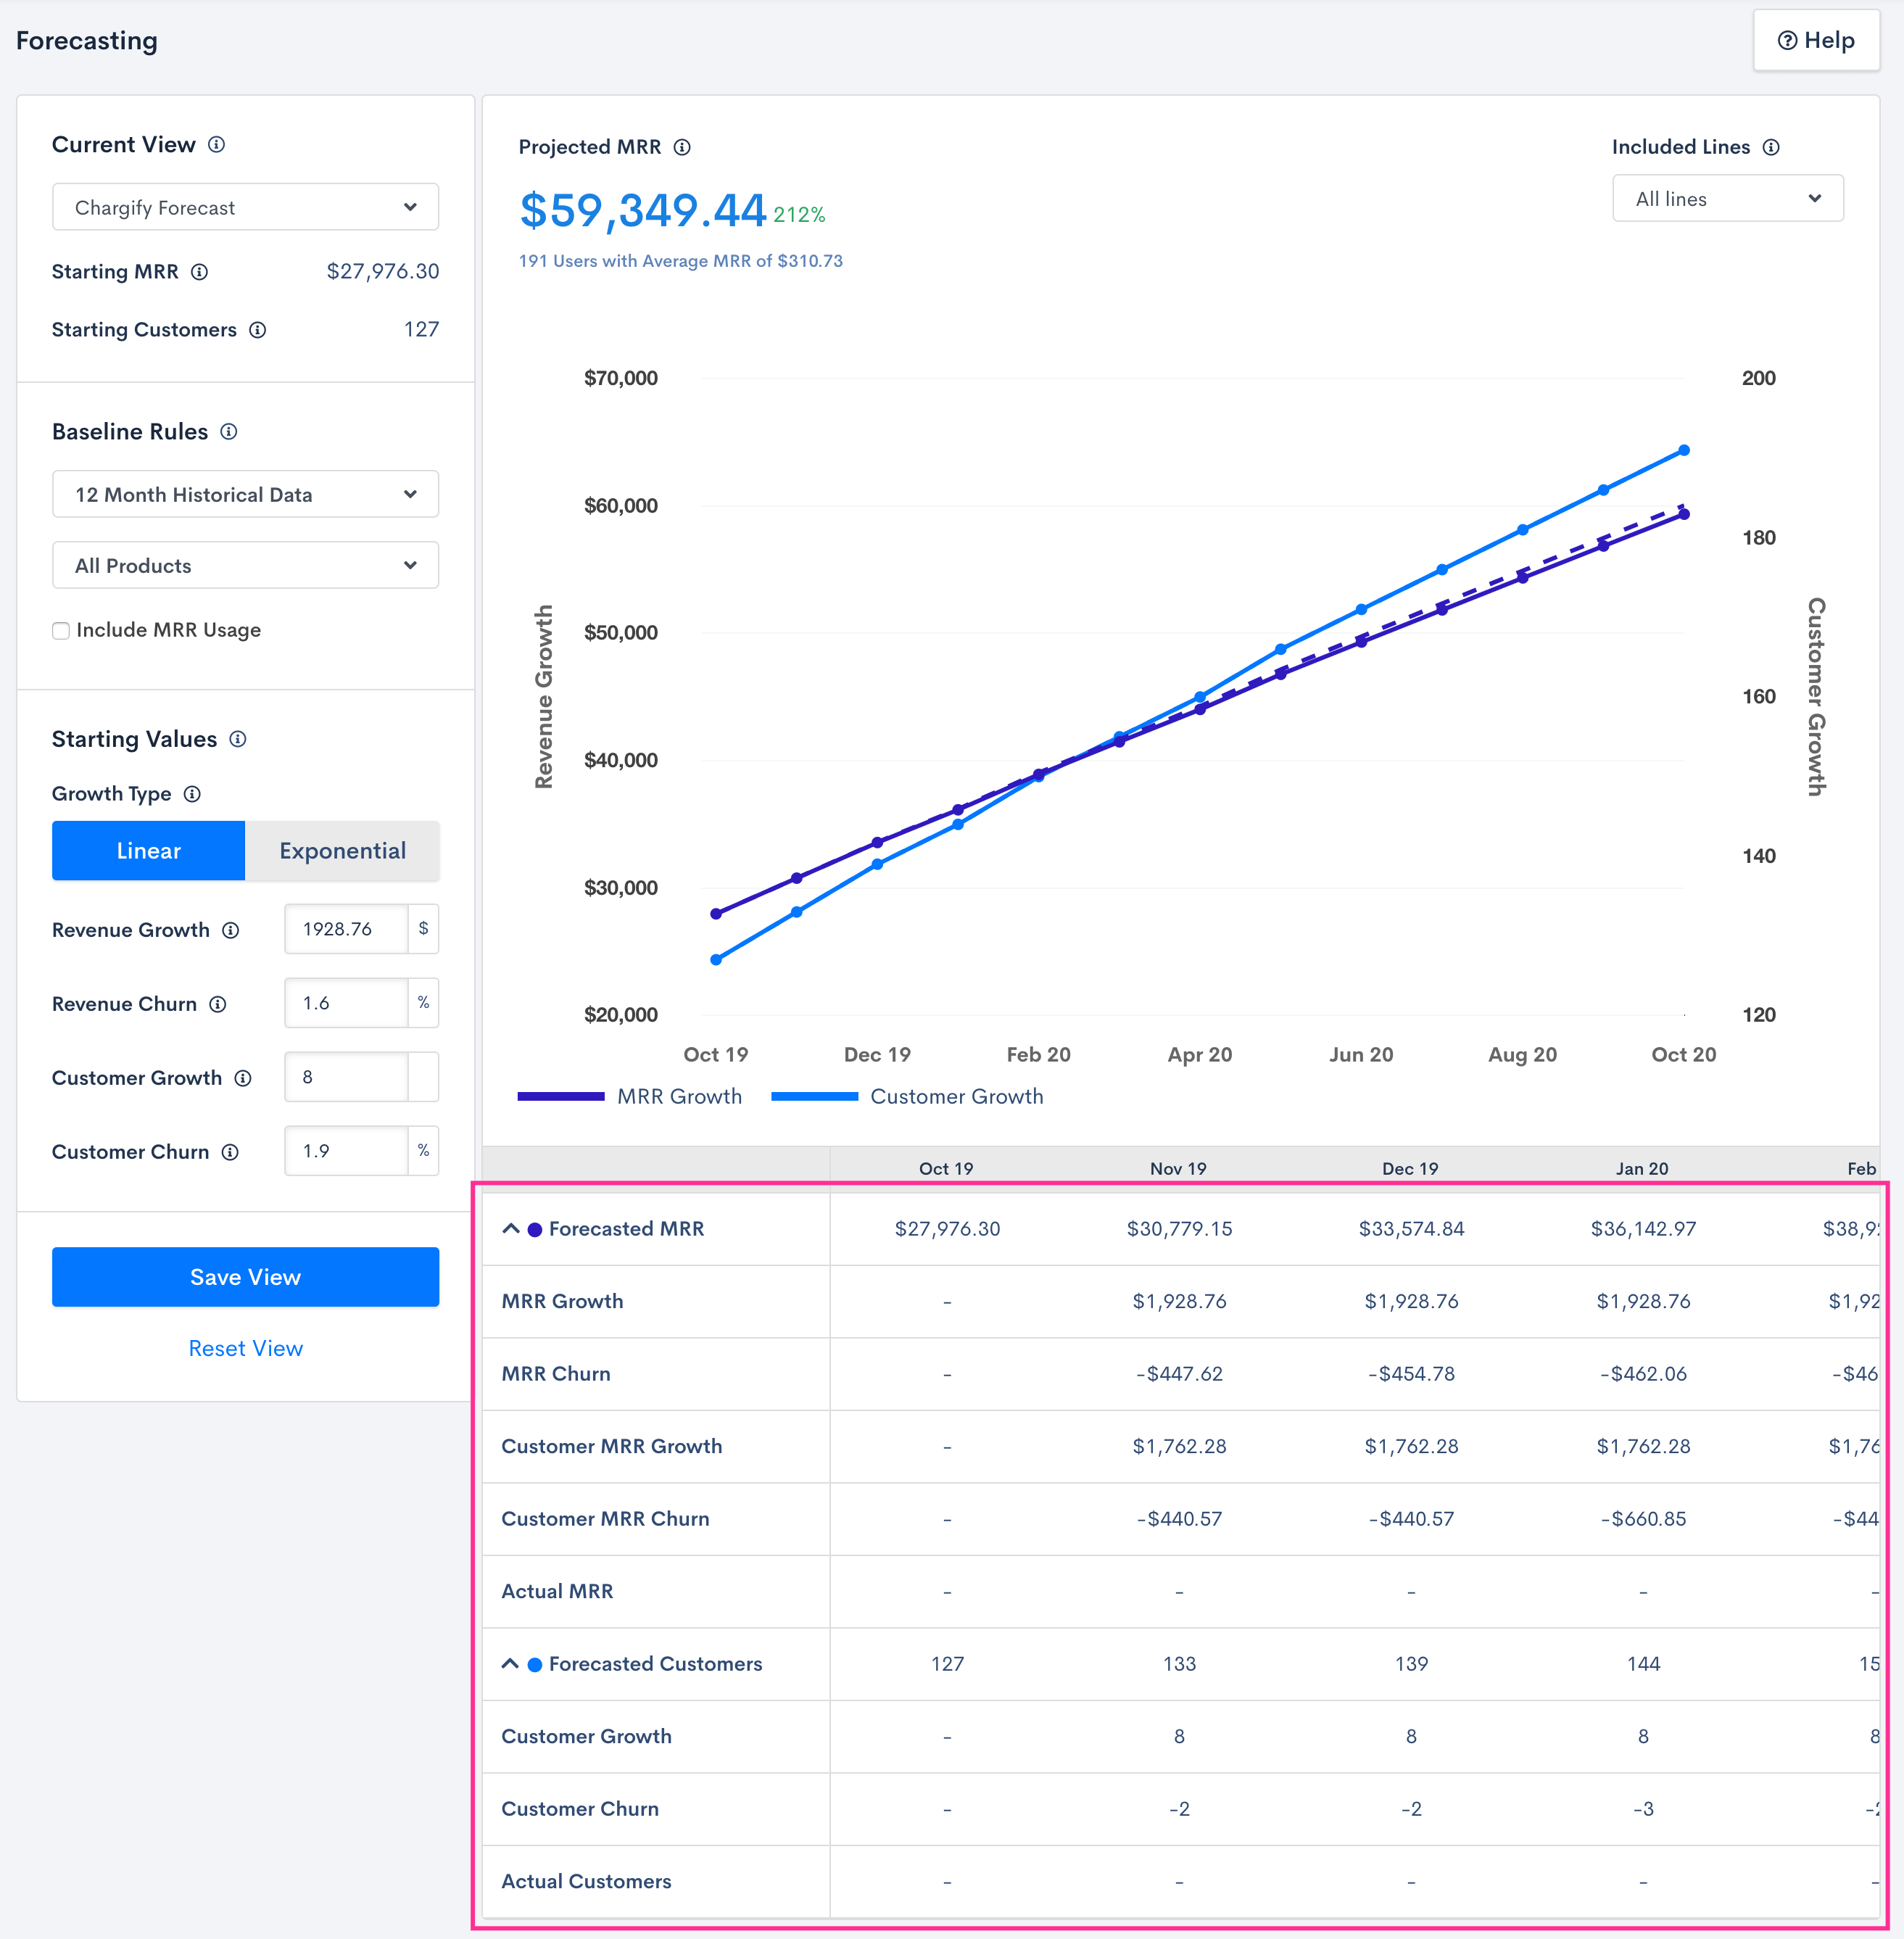
Linear results
Forecasted MRR - Forecasted MRR will be the previous month’s MRR plus the sum of the MRR Growth, MRR Churn, Customer MRR Growth and Customer MRR Churn
MRR Growth (linear) - Growth amounts for linear growth will always equal the (8) Revenue Growth amount
MRR Churn - Churn amounts will be calculated by taking the Starting MRR and multiplying the (8) Revenue Churn rate. It will then increase each month by the same (8) Revenue Churn rate.
Customer MRR Growth - Customer MRR growth is calculated by taking the Customer Growth and multiplying it by the average MRR. Average MRR is calculated by taking the Starting MRR and dividing it by the Starting Customers.
Customer MRR Churn - Customer MRR growth is calculated by taking the Customer Churn and multiplying it by the average MRR. Average MRR is calculated by taking the Starting MRR and dividing it by the Starting Customers.
Forecasted Customers - Forecasted Customers will be the previous month’s customer count plus the sum of Customer Growth and Customer Churn
Customer Growth (linear) - Customer growth will always equal the (10) Customer Growth amount
Customer Churn - Customer Churn will be calculated by taking the Starting Customers amount and multiplying the (11) Customer Churn rate. It will then increase by the same (11) Customer Churn rate each month.
Exponential forecast calculations
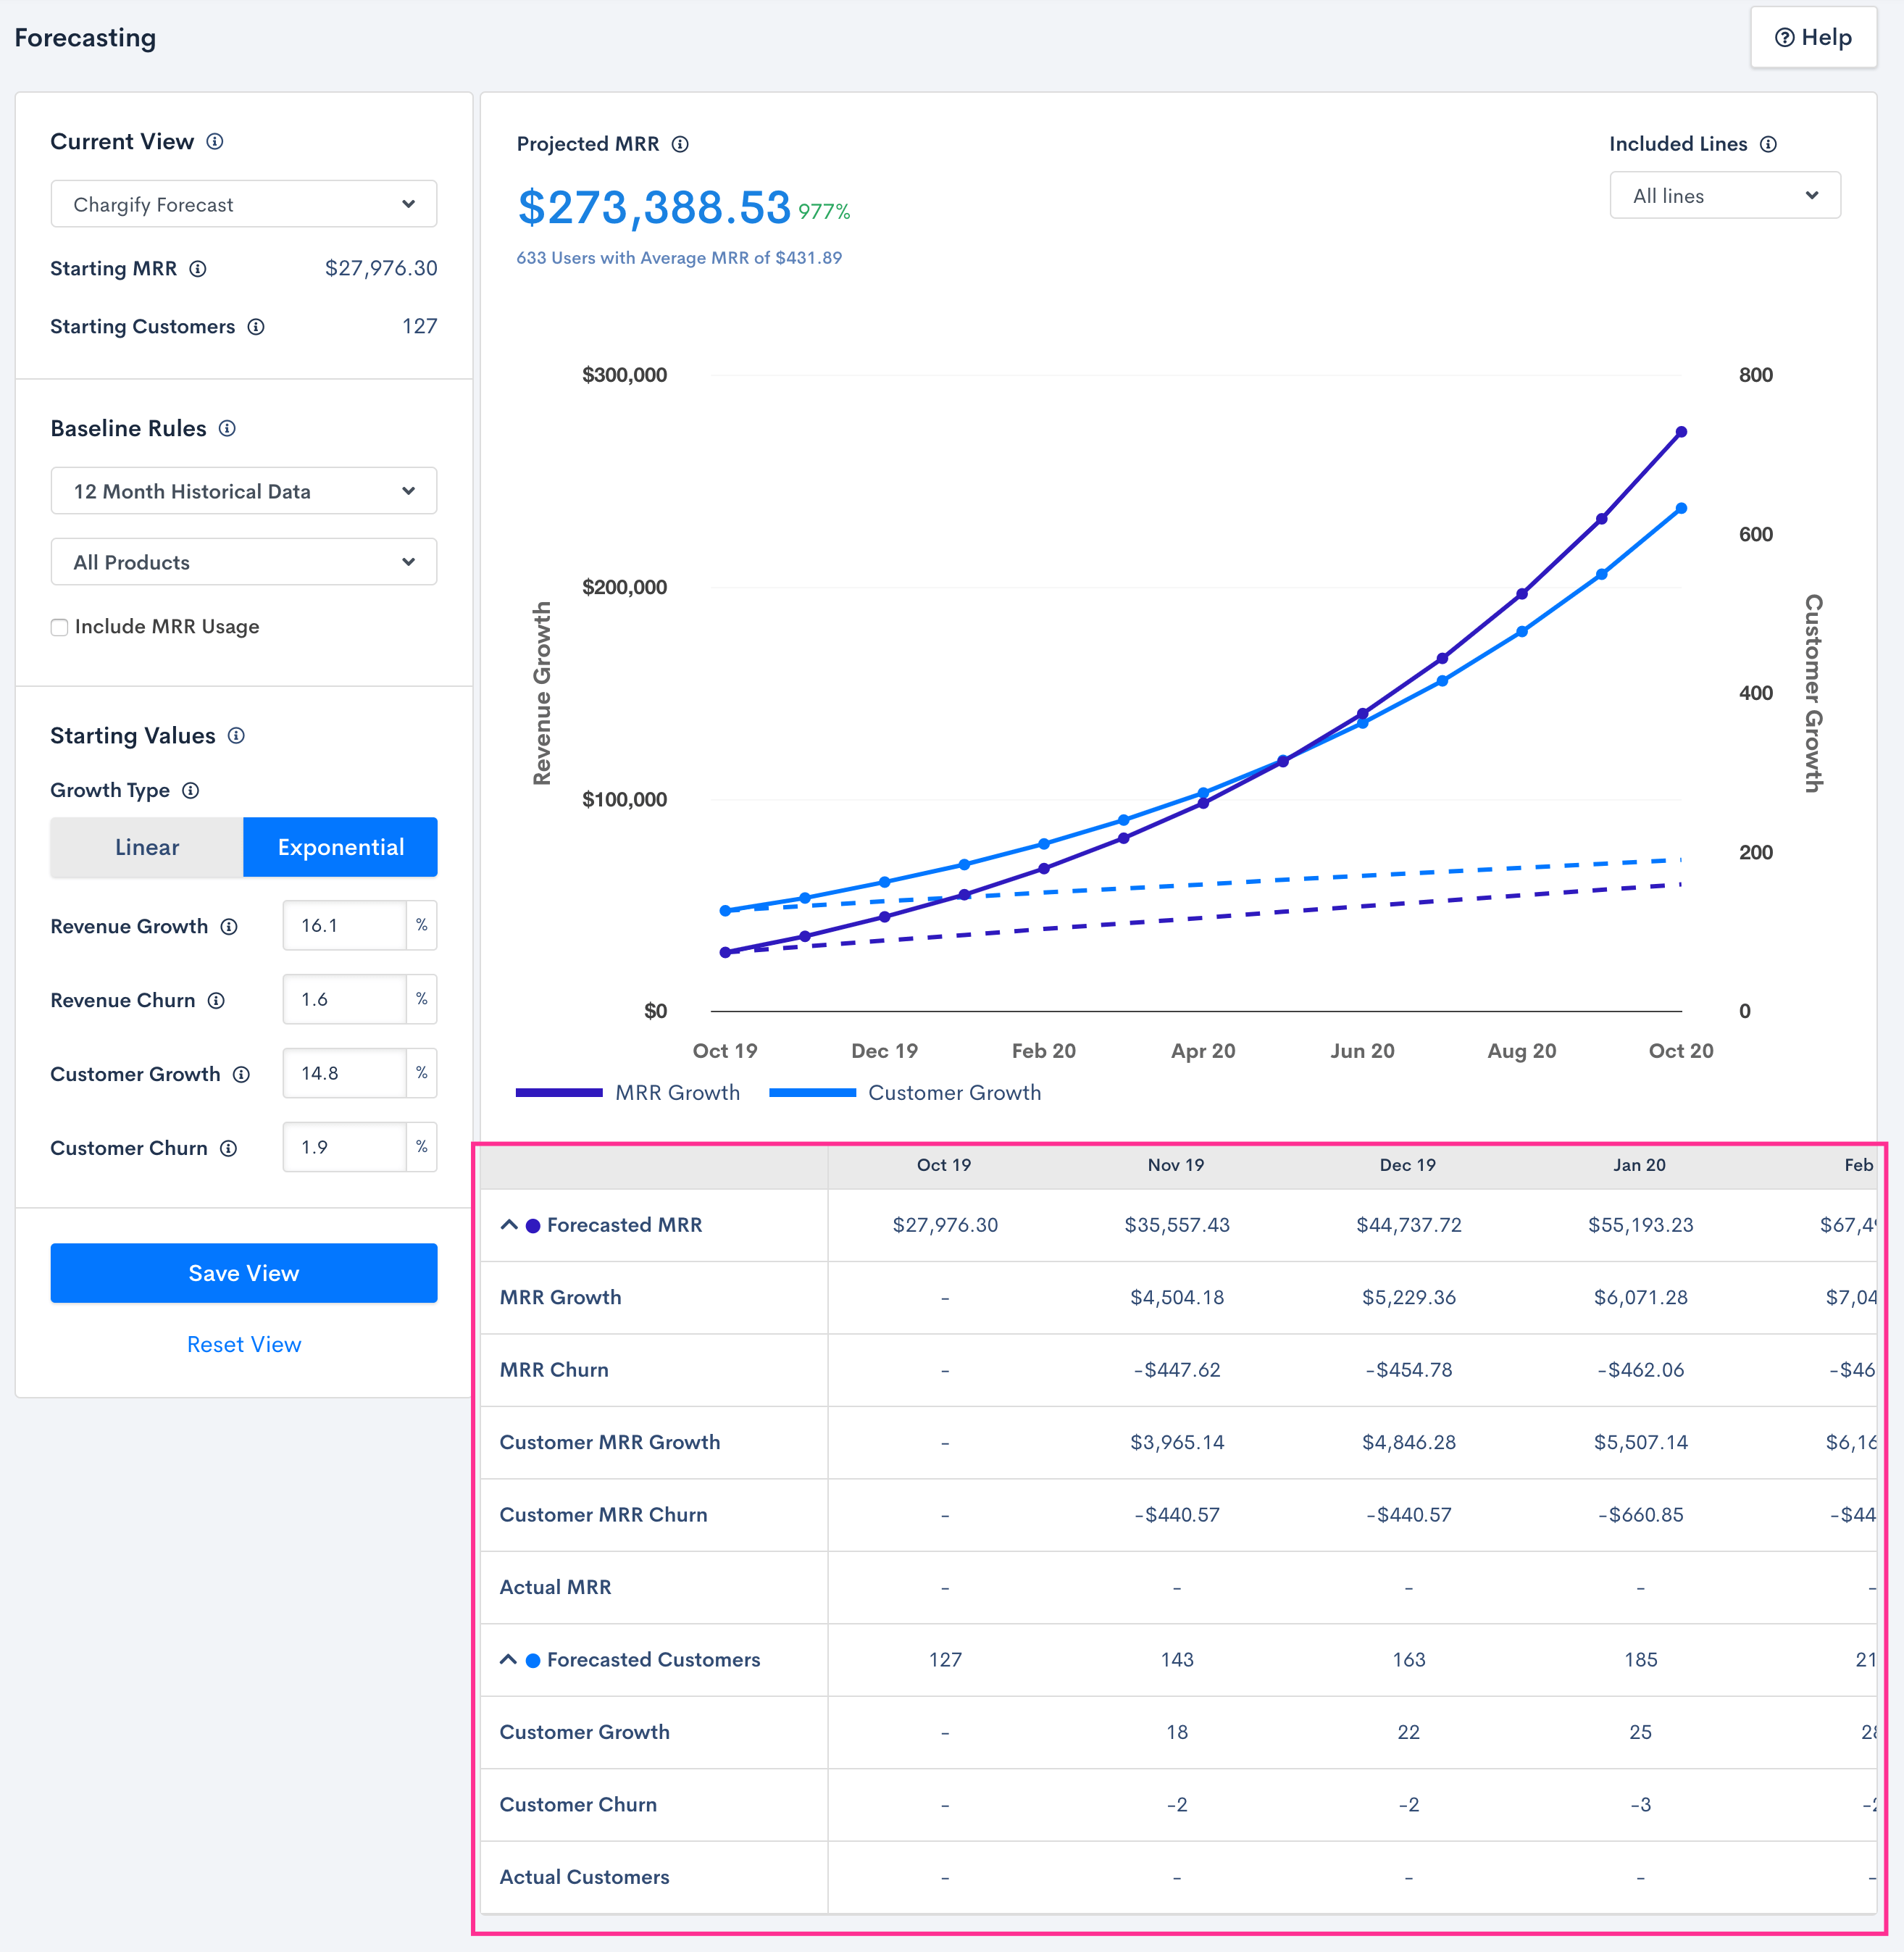
Exponential results
Forecasted MRR - Forecasted MRR will be the previous month’s MRR plus the sum of the MRR Growth, MRR Churn, Customer MRR Growth and Customer MRR Churn
MRR Growth (exponential) - Growth amounts for exponential growth will be calculated by taking the Starting MRR and multiplying the (8) Revenue Growth rate. It will then increase each month by the same (8) Revenue Growth rate.
MRR Churn - Churn amounts will be calculated by taking the Starting MRR and multiplying the (8) Revenue Churn rate. It will then increase each month by the same (8) Revenue Churn rate. calculated Customer MRR Growth - Customer MRR growth is calculated by taking the Customer Growth and multiplying it by the average MRR. Average MRR is calculated by taking the Starting MRR and dividing it by the Starting Customers.
Customer MRR Churn - Customer MRR growth is calculated by taking the Customer Churn and multiplying it by the average MRR. Average MRR is calculated by taking the Starting MRR and dividing it by the Starting Customers.
Forecasted Customers - Forecasted Customers will be the previous month’s customer count plus the sum of Customer Growth and Customer Churn
Customer Growth (exponential) - Customer growth will be calculated by taking the Starting Customers amount and multiplying the (10) Customer Growth rate. It will then increase by the same (10) Customer Growth rate each month.
Customer Churn - Customer Churn will be calculated by taking the Starting Customers amount and multiplying the (11) Customer Churn rate. It will then increase by the same (11) Customer Churn rate each month.
Exporting data
For more information on exporting your forecast: Exporting Data.